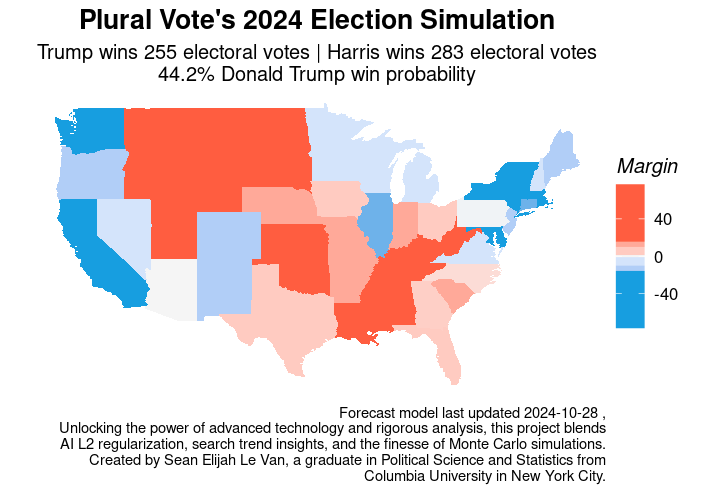
Electoral Commentary & Legend
As we navigate the electoral landscape, the map vividly illustrates the balance of power between candidates. Each state represents a unique set of votes, reflecting the hopes and aspirations of its constituents.
Color Coding:
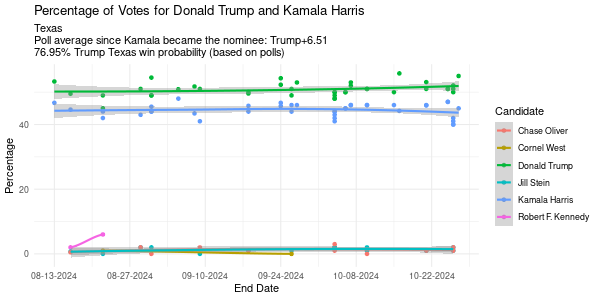
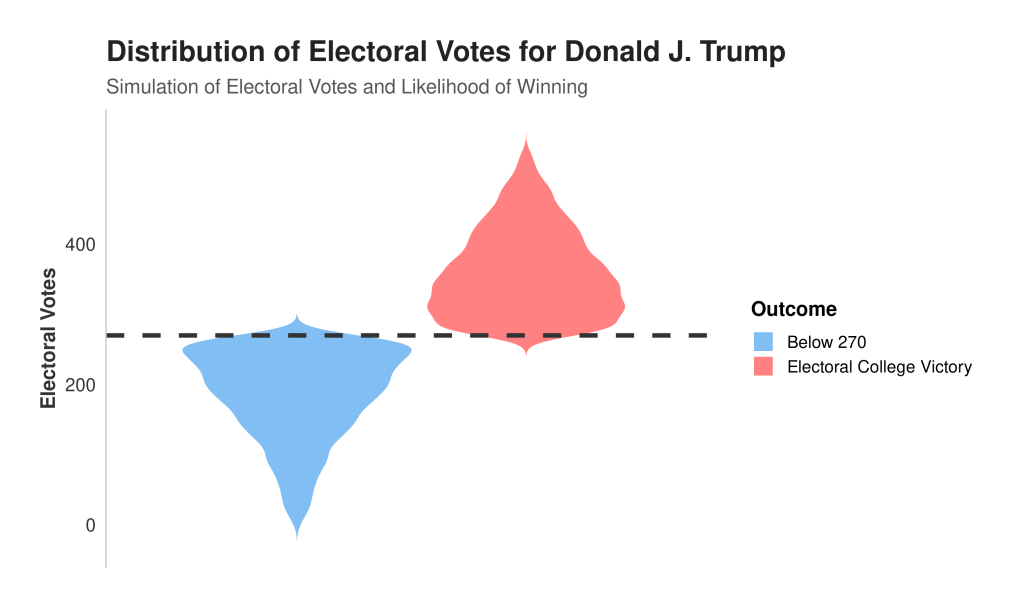
- Red: Trump Win – Total: 214 electoral votes (States: Florida, Texas, Indiana, Missouri, etc.)
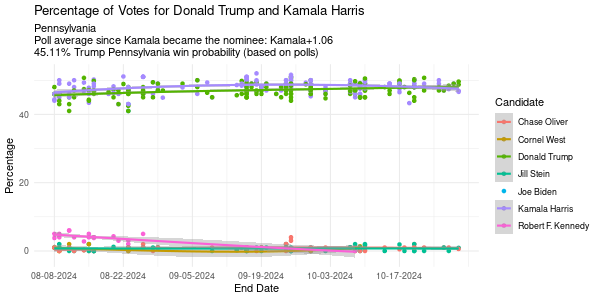
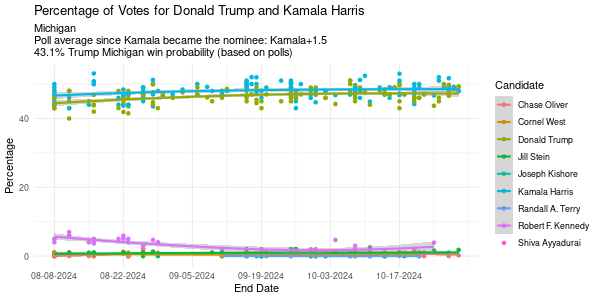
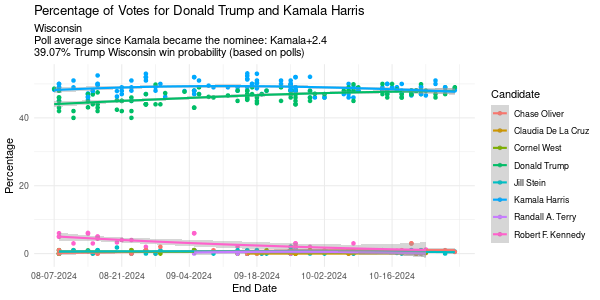
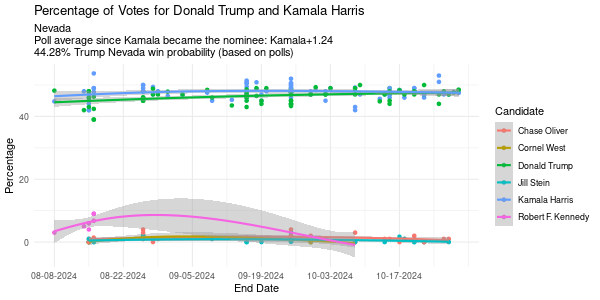
- Blue: Harris Win – Total: 257 electoral votes (States: California, New York, Maryland, Wisconsin, Michigan, Nevada, etc.)
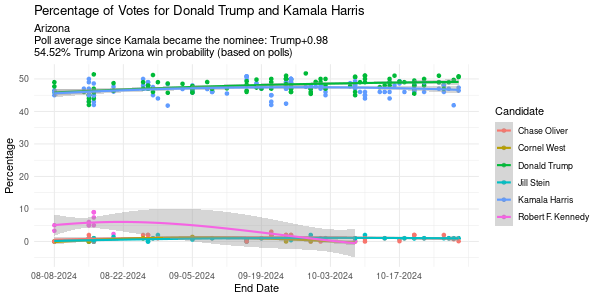
- Neutral: Within 1.5 Points – Total: 62 electoral votes (States: Arizona, North Carolina, Georgia, etc.)
This visualization not only highlights potential outcomes but also invites us to engage with the democratic process. May our collective efforts lead to a bright and harmonious future!
| State | Prediction | Delegate |
|---|---|---|
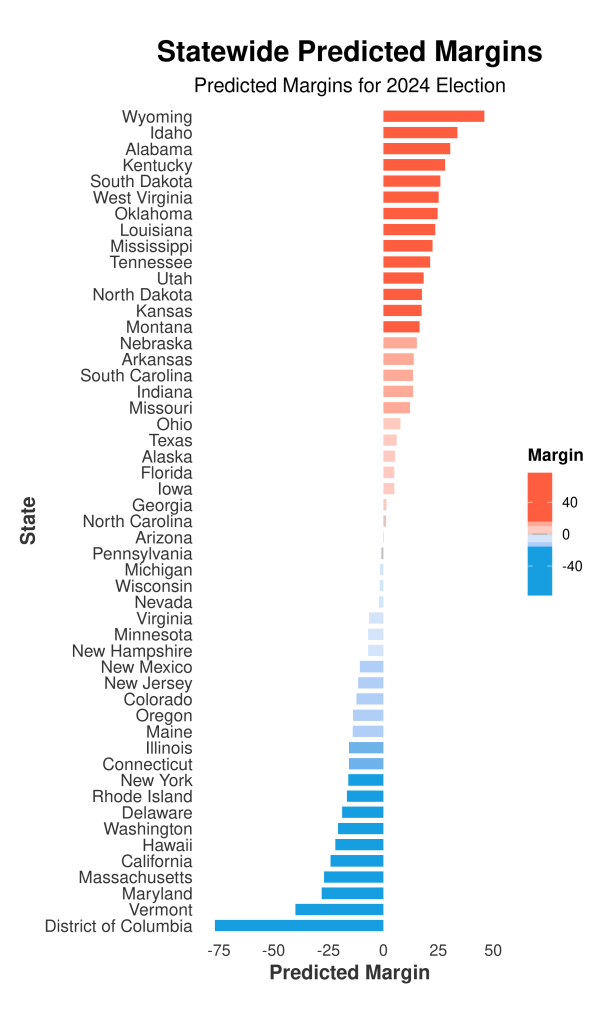
| District of Columbia | -76.77 | 3 |
| Vermont | -40.14 | 3 |
| Maryland | -28.22 | 10 |
| Massachusetts | -27.08 | 11 |
| California | -24.10 | 55 |
| Hawaii | -21.92 | 4 |
| Washington | -20.76 | 12 |
| Delaware | -18.76 | 3 |
| Rhode Island | -16.59 | 4 |
| New York | -16.00 | 29 |
| Connecticut | -15.68 | 7 |
| Illinois | -15.68 | 20 |
| Maine | -13.95 | 2 |
| Oregon | -13.80 | 7 |
| Colorado | -12.34 | 9 |
| New Jersey | -11.56 | 14 |
| New Mexico | -10.75 | 5 |
| New Hampshire | -6.95 | 4 |
| Minnesota | -6.94 | 10 |
| Virginia | -6.57 | 13 |
| Nevada | -1.99 | 6 |
| Wisconsin | -1.74 | 10 |
| Michigan | -1.54 | 16 |
| Pennsylvania | -0.92 | 20 |
| Arizona | 0.18 | 11 |
| North Carolina | 1.17 | 15 |
| Georgia | 1.34 | 16 |
| Iowa | 4.91 | 6 |
| Florida | 4.92 | 29 |
| Alaska | 5.32 | 3 |
| Texas | 6.05 | 38 |
| Ohio | 7.81 | 18 |
| Missouri | 12.04 | 10 |
| Indiana | 13.45 | 11 |
| South Carolina | 13.49 | 9 |
| Arkansas | 13.81 | 6 |
| Nebraska | 15.23 | 2 |
| Montana | 16.48 | 3 |
| Kansas | 17.46 | 6 |
| North Dakota | 17.57 | 3 |
| Utah | 18.34 | 6 |
| Tennessee | 21.25 | 11 |
| Mississippi | 22.35 | 6 |
| Louisiana | 23.60 | 8 |
| Oklahoma | 24.64 | 7 |
| West Virginia | 25.09 | 5 |
| South Dakota | 26.01 | 3 |
| Kentucky | 28.18 | 8 |
| Alabama | 30.48 | 9 |
| Idaho | 33.67 | 4 |
| Wyoming | 46.02 | 3 |
Leave a Reply